By Cindy Atman
This is a story about how listening to design became a thing.

By Cindy Atman
This is a story about how listening to design became a thing.
I began my research on design processes back in the early 1990’s. The goal of my work was to figure out how to teach engineering students about considering the broader context of the design problems they were solving. This led to years of verbal protocol studies, recording how individuals with different levels of design experience solved design problems. The result was an archive of design timelines from 177 individuals. You can find a short summary of the research on this webpage: The Research . A paper describing the full research story is here: “Design timelines: Concrete and sticky representations of design process expertise”, and a talk describing my research journey is here.
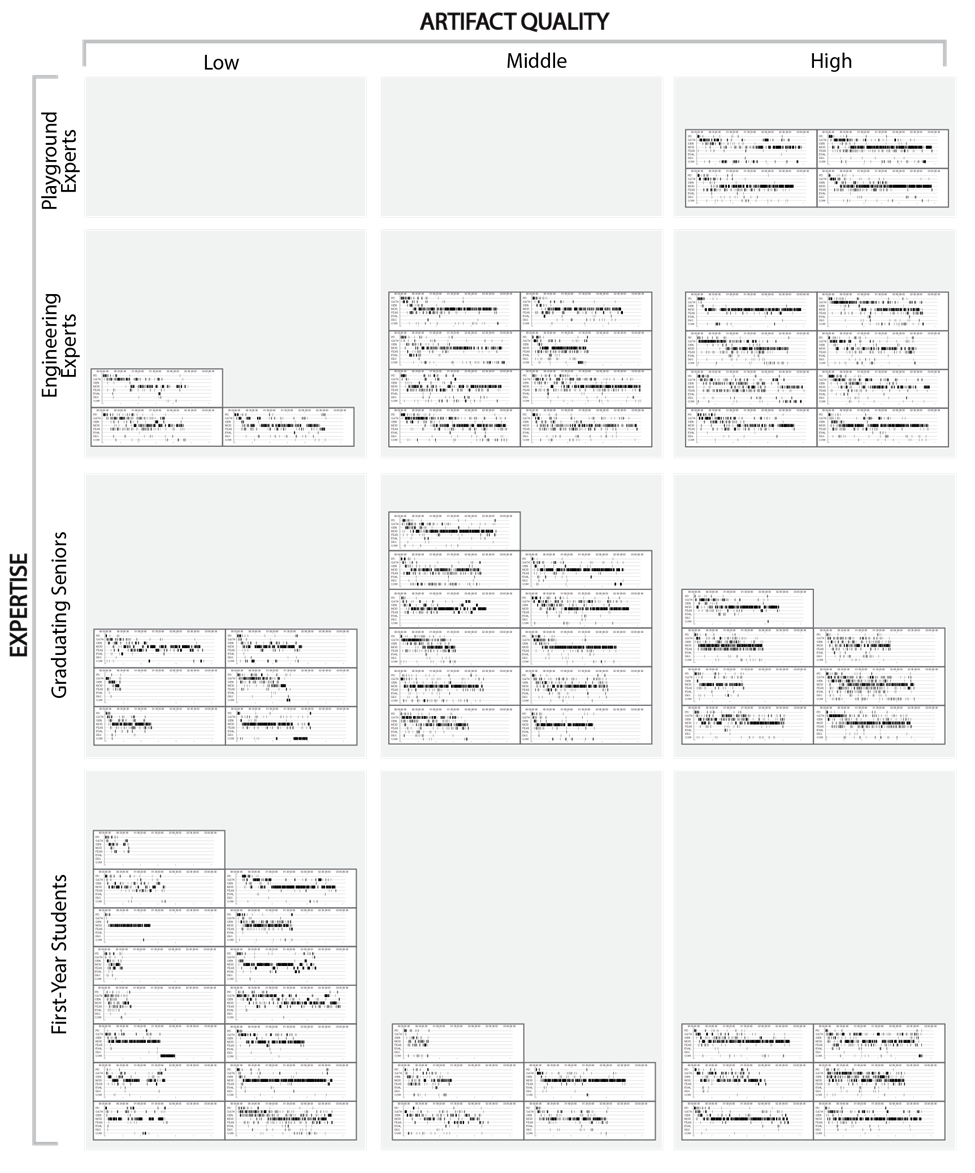
Long story short on the music. Over the decades, as I was describing my work through design timelines, people would invariably say that the timelines look like musical scores. As an example, you can see a figure from the “Design timelines” paper (referenced above) that displays timelines from 73 designers who designed a playground for a fictitious neighborhood in around 2 to 3 hours in a lab-based setting.
We agreed, our timelines did look like music. We also thought it could be engaging for designers to explore how design might sound like, so we created a way to play our timelines. Zach Goist, a masters student in my department, Human Centered Design & Engineering at the University of Washington, created an interactive system using Flash Player. He created sound files for a full instrumental version, drums and bells for nine timelines of designers from the playground problem with various levels of design expertise. Here was the front page.

It was a beautiful system that allowed exploration and reflection on design processes. Unfortunately, Adobe stopped supporting Flash Player in 2020 and our system has been broken since then. We still have the sound files, and wonder if there is anyone out there who might be interested in helping us recreate the full experience?
Here we can give you a small flavor of the experience with the system with two segments of sound. Below is a figure that displays six timelines from playground designers. The data are described in more detail in The Research.
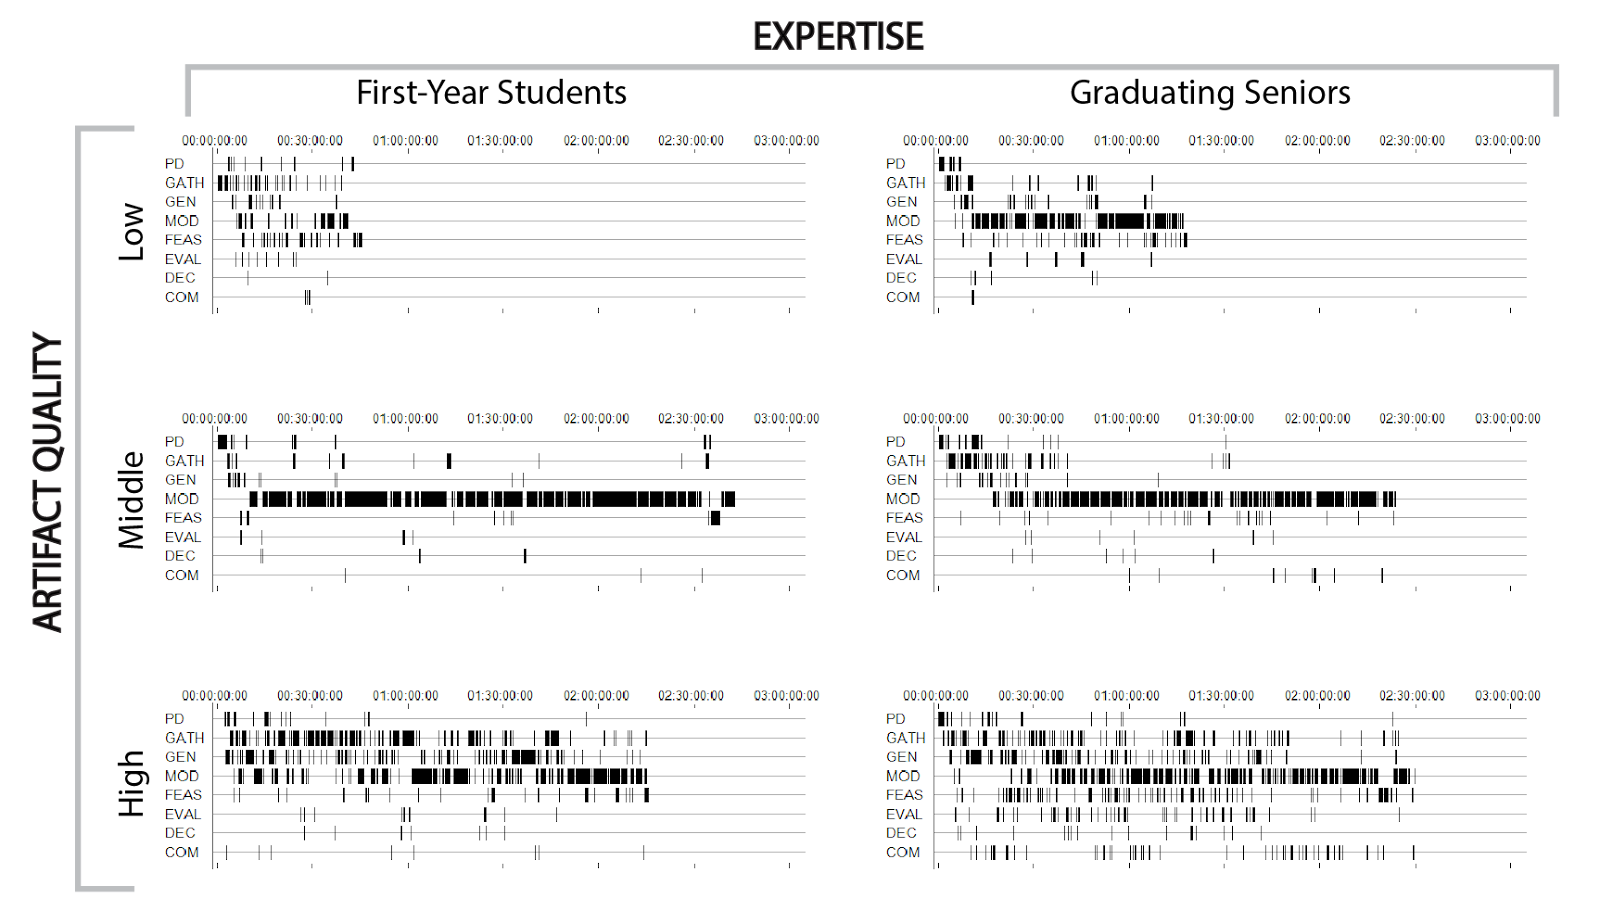
The three timelines in the column on the left are from first-year students, and the three in the column on the right are from graduating seniors - all in engineering programs. The rows show timelines from individuals who designed high quality (bottom row), middle quality (middle row) and low quality (top row) playgrounds. The differences across the timelines are notable. Here you can listen and compare a “bells” version of:


I want to give credit for the snippet of music we used for the tile in the previous page. It is from Leonard Cohen’s song “Anthem.” Specifically, it is from my favorite lines in the song:
.png)
Ring the bells that still can ring
Forget your perfect offering
There is a crack, a crack in everything
That’s how the light gets in